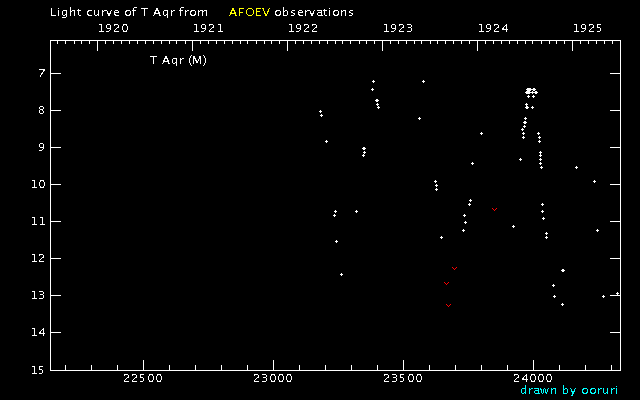
 Light Curve of T Aqr (T Aquarii) from the AFOEV database (1920-1924)
  Light Curve of T Aqr (T Aquarii) from the AFOEV database (1920-1924)

* White dots and red "v" symbols represent positive observations and upper limits, respectively
![]()
![]()
 Back to the index to AFOEV light curve of T Aqr
 Previous : R Aqr (AQRR)
 Next : R Ari (ARIR)
 AFOEV curve (1925-1929) : T Aqr (AQRT)
 GIF chart based on Hipparcos & Tycho
  GIF chart based on Hipparcos & Tycho (2)
  GIF chart based on GSC and Tycho-2 magnitudes (V,B-V)
  GIF chart based on HIC
  Latest VSNET light curve
  VSNET light curve interactive page
  VSNET Data Search (AQRT)
 AFOEV light curve
  VSOLJ light curve
  VSOLJ data (in JD) [instructions to usage]
 VSOLJ data (in UT) [instructions to usage]
 VSOLJ light curve interactive page
 Request VSOLJ data to Makoto Watanabe (VSOLJ database manager)
 Request VSOLJ data to Makoto Watanabe (VSOLJ database manager)
 MISAO project page
  VSNET/Internet Article Search

 Return to the Powerful Daisaku Nogami
vsnet-adm@kusastro.kyoto-u.ac.jp
