 Light Curve of RX Ret (RX Reticuli) from the AFOEV database (1990-1995) Light Curve of RX Ret (RX Reticuli) from the AFOEV database (1990-1995)
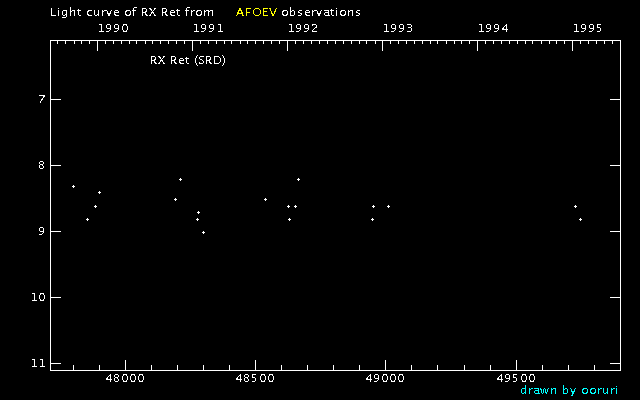
* White dots and red "v" symbols represent positive observations and upper limits, respectively


 Back to the index to AFOEV light curve of RX Ret
 Previous : T Pyx (PYXT)
Next : S Scl (SCLS)
AFOEV curve (1985-1989) : RX Ret (RETRX)
Previous : T Pyx (PYXT)
Next : S Scl (SCLS)
AFOEV curve (1985-1989) : RX Ret (RETRX)
 GIF chart based on Hipparcos & Tycho
 (2)
GIF chart based on GSC and Tycho-2 magnitudes (V,B-V)
GIF chart based on HIC
GIF chart based on Hipparcos & Tycho
GIF chart based on Hipparcos & Tycho (2)
GIF chart based on GSC and Tycho-2 magnitudes (V,B-V)
GIF chart based on HIC  VSNET Data Search (RETRX)
AFOEV light curve
MISAO project page VSNET/Internet Article Search
VSNET Data Search (RETRX)
AFOEV light curve
MISAO project page VSNET/Internet Article Search
 Return to the Powerful Daisaku Nogami
vsnet-adm@kusastro.kyoto-u.ac.jp

 Return to Home Page